While developing a web page, visual errors are almost inevitable. It becomes really frustrating when, after hours of coding, you notice that a certain element is not properly aligned or colored, or worse not is not cross browser compatible. Debugging an HTML or CSS code can really slow down a developer’s creative momentum. But if you have the knowledge of how to detect and fix rendering issues properly, web development becomes much fun and interesting. Every issue faced by a developer is unique in its own way, but if you adhere to some basic rules and checklist, coding will become much easier. Let’s take a look at the following article and find out how debugging can help you fix common issues in HTML.
Syntax Error
While encountering errors, the instinct of a developer jumps to one question most of the times, whether the code is syntactically correct. No matter, how experienced you are, mistakes like typos, or an incorrectly closed tag is quite common.
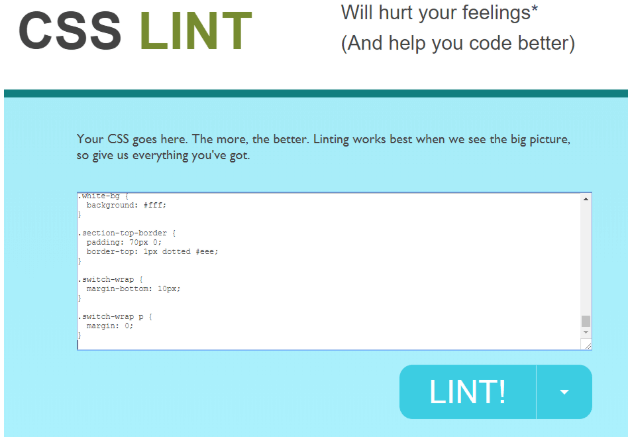
If you are developing a large application, in order to check for syntax error or typographic mistakes, validation tools will really be helpful. CSS Validator and Markup Validation Service by W3C will do the job perfectly. Once you run the code in validators, they will raise an error or warning wherever something has gone amiss. However, often it will be difficult to find complex errors. Because detailed debugging is impossible in those validators. A better alternative is CSS lint, which can perform a detailed analysis of your HTML or CSS code and find out each and every error, no matter how small it is.

Hey, are you looking for BroadcastChannel- BroadcastChannel allows other scripts running on the same origin to send messages to each other. Via this API you can create powerful multiorganization applications that coexist even though they are in different browsing contexts.
Cross Browser Compatibility Issues
In the earlier days when the desktop was the only mode of accessing internet and a very few browsers were there to display the webpages, cross browser issues were uncommon. But nowadays, with mobile devices being the primary medium for accessing webpage, and multiple browsers being used across various devices, cross browser issues are quite common. A website may look perfect in one browser but may not get displayed correctly in another. Cross browser issues can be prevented by making them happen in the very beginning.
First of all, make sure that you are normalizing the CSS code. This will prevent the inconsistencies between browsers and make them behave in a coordinated manner. Even when you are developing a single page and not using any CSS framework, using CSS reset is a good practice to prevent cross browser issues.
Secondly, check and make sure that all the CSS and HTML properties you are using are supported by all browsers. Both CSS and HTML are evolving and many new tags are coming up everyday that are not supported by all browsers. In that case, you have to use either vendor prefix or use a tag that is supported by all browsers.
Cross browser compatibility testing tools like LambdaTest allow you to test your websites on 3000+ browser and OS combinations for cross browser compatibility issues and ensure that your website renders perfectly on various browsers, operating systems, devices, and viewports.
LambdaTest also supports a majority of the test automation frameworks to perform Selenium testing, Cypress testing, E2E testing, and more.
Outlining Elements
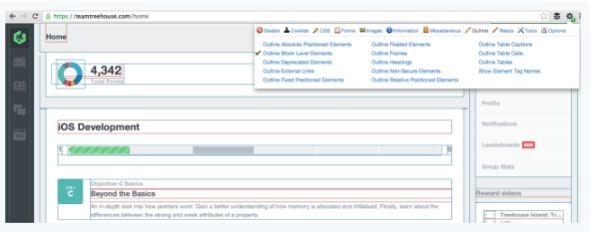
It really becomes helpful when a developer can outline the elements rendered in a page to find out whether they are related to one another. Writing CSS for this can be a time-consuming job. An easier option is to use a plugin named Web Developer. This browser extension is available for Firefox, Opera and Chrome.
It helps the developer to outline elements based on criteria like element type or display type. On first look, it may seem a bit complicated, but with a little bit of practice, this tool gets easier to use and the developer can easily detect mixed display type or rogue floats using this.

Also check out Clipboard API- The Clipboard API is a way for apps to provide copy, cut, and paste functionality with other apps. It also gives you access to the operating system clipboard.
Turning off Styles
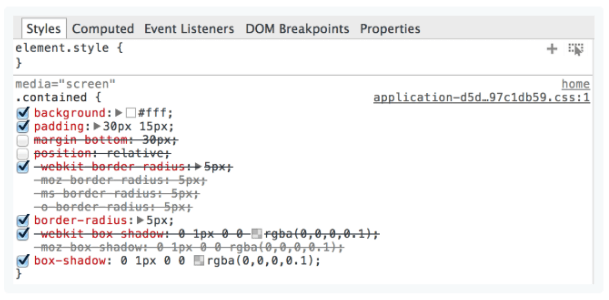
Often it may get difficult to figure out how a particular element in your page is impacted by CSS. The browser’s inbuilt developer tool makes it easier to toggle CSS properties individually. After you bring up the developer console, on the right, elements panel can be noticed. It shows the CSS properties applied on the element that you selected. Once you hover over the properties, they can be individually unchecked. If you find an element that is crossed out, it means that another CSS is used to override it.
The process may seem a little tiring, but it is one of the fastest procedure to find out style errors which are inconsistent with your CSS. Whether a CSS that you have written is applied on the element or whether it is being overridden by the default CSS in the library can be detected using the developer console.

Don’t forget to check out console.time and console.timeEnd- Used for experiments, console time io is a professional set of functions for measuring website performance metrics.
Display Type
In a web page, elements usually have display type. The type may be flex, block, inline-block etc. It is difficult to figure out how browsers will handle elements having mixed display type. So it is better to write your CSS according to W3C standards.
Debugging is a tricky art that improves with practice. Apart from the techniques mentioned here, many more are there that can help you debug your HTML and successfully resolve the error. Also, after fixing errors, do remember to test your website properly in different devices and browsers and find out if all the critical functionalities are working properly before deploying it in production.
