Most of the mainstream browsers offer solution to debug web issues, be it minor CSS tweaks, checking performance logs, console errors or issues in scripting. But the problem arises when a website works perfectly in desktop, but causes major errors in Android device. The answer is remote debugging, which will enable you to connect the android device to your workstation via a USB cable and debug your mobile webpage on your desktop.
On a side note, you can debug multiple device sizes while performing responsiveness tests simultaneously. Also mark a bug on tools, such as Jira, Trello, Asana, GitHub, etc. LT browser the best dev-friendly browser for mobile view debugging on which you can see the mobile view of your website on Android emulator and iOS resolutions. LambdaTest provides you features to perform cross browser and responsive testing over an online browser farm of 3000+ browsers and operating system at scale. It also supports, Playwright, Selenium testing, Cypress testing, to speed up your test automation.
Now Let’s take a look at how to test on firefox browser makes remote debugging easier for developers.
Also check, Progress Element:- The method is to use the progressive form to imply the state of being in progress, whether it is incomplete or not.
What Will You Need?
The prerequisites are readily available with any developers and those which are not, can be downloaded or obtained without any cost. For your PC you will need
Chrome version 15 or above installed and properly working on your workstation.
If you are using Windows, USB drivers are required.
A USB cable to connect your Android device with the desktop or laptop.
For the Android device, the following things are required.
Latest version of Firefox, preferably version 35 or above.
Android version 4 or above.
USB debugging enabled in the developer options for Android.
How to Connect Your Workstation and the Android Device?
Your workstation can communicate with the mobile device with the help of Android Debug Bridge (ADB). It is a client-server program that allows you to execute commands to the device. Let’s deep dive into the process
Enable USB debugging in your mobile and attach it to the desktop via USB
Make sure you have installed the correct version of Android SDK.
ADB will be installed in the “platform-tools” directory.
Test whether it is working or not by executing adb devices command in the command shell. If the output contains the name of the device attached to your workstation, this means ADB is working fine.
The desktop browser also needs to have the adb helper add-on installed. If you find it missing, go to the Projects menu and navigate to “Manage Extra Components”. The “Extra components” window will appear, containing an entry for adb helper. Click on the install button and it will be added to your desktop browser.
Did you know Registerprotocolhandler- Navigator.registerProtocolHandler is used when a web page wants to behave as a handler for a particular protocol — that is, when the user clicks on links or types URLs starting with the protocol’s scheme in their address bar.
Getting Started with Remote Debugging
The basics being covered, you will now need to enable remote debugging for both your desktop as well as mobile. In the mobile device
Open Firefox and go to the Menu
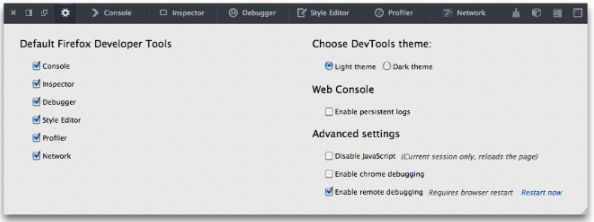
At the settings, you will find the Developer Tools option. Navigate there and enable the “Remote Debugging” checkbox.
On the dekstop
Open Firefox
Open the Toolbox and go to Settings
Just like mobile, Enable remote debugging checkbox will be found under the settings tab. Check it and close the Toolbox.

After executing the command, at your desktop, go to the Web Developer option in Firefox and click on “Connect”. A page will appear containing the hostname and port number.
Click on the connect button and a pop up will appear on the mobile device asking permission to confirm. Press Ok and your mobile device will be connected to the desktop.

- A notification will appear in the desktop window prompting that connection is successful and the default tabs in mobile browser are now available at desktop.
Hey, do you know rel-noreferrer- If you link to your own site or to social media using rel=”noreferrer”, you’re helping protect your users’ privacy.
Limitations of the Debugger and How to Overcome Them
From version 52, Firefox has introduced a new debugger that is by default enabled in the developer edition. Although it is more reliable and much faster, there are certain limitations as well. Let’s list them down.
DOM event breakpoints are not supported by the new debugger. When you are trying to debug your JavaScript, breakpoints are important since it can command the debugger to stop event execution. This limitation of the new debugger will make it difficult for developers to debug script related issues in Android.
The new debugger also does not support inspecting DOM nodes. When you hover on a DOM node in the developer console it gets highlighted in the rendered webpage
Since these features are not supported, developers will have to go back to the previous debugger version in order to use it. This can be done by going to the about:config where you will find a preference named “devtools.debugger.new-debugger-frontend”. Mark it false and you will be able to inspect DOM nodes and set breakpoints again.
The remote debugger of firefox is easy to use and easier to setup than other major browsers and enables developers debug their website issues in Android and fix them before deployment. Although the new version has some drawbacks, hopefully they will be fixed in the next release.
